The SAAM Prototype provides currently two functions: plotting of data in the database and superposed epoch analysis. However, to provide these functions, prototype database and database tools first had to be created.
The SAAM Prototype runs as Java applications, which means that it can only be run at the SAAPS server. The necessary Java applets will be developed so that SAAM Prototype will be accessible from a web browser.
The first version of the database contained methods for creating, storing, and retrieving data containing arbitrary formats and arbitrary number of fields. However, later on it was realized that this kind of database introduced unwanted complexities in the modules accessing the database. Another aspect was the extra computation needed slowing down the system. Therefore, it was decided to slim down the database by carefully examining the data that will go into the database, and the two types of data that will enter the database are:
The physical storage format of the single parameter (SP) data are: long, double, long, double, .... The long field is the time of the observation in milliseconds (ms) from January 1st, 1970, and the double field is the observed value. There are then methods to convert between the ms format and a date format like yyyy-mm-dd hh:mm:ss. As an example, the solar wind IMF Bx-component from ACE will be stored in a file ACEBx.data with the data t, Bx(t), t+Dt, Bx(t+Dt), ....
Associated with every database file is a metadata file containing the following fields: a short description of the parameter (String), the time of the first observation (long), the time of the last observation (long), the length of the sample interval (long), and the value representing data gaps (double). Again, with the above example the file would be ACEBx.meta.
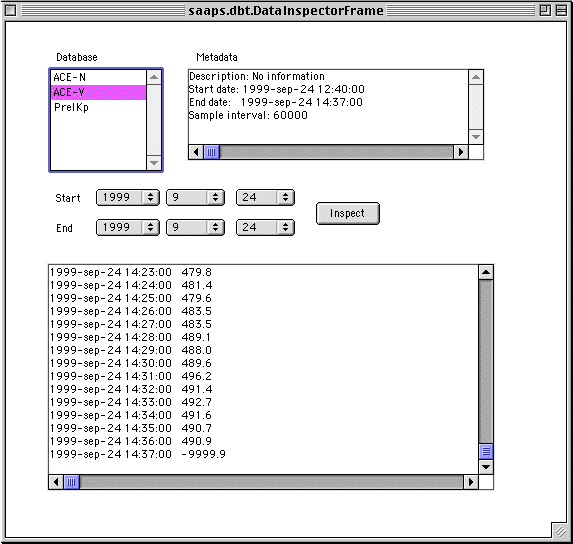
There are also user interfaces to inspect and plot the data and metadata in the database. Currently they run as Java applications, which means that they can only be used locally on the server. A snapshot of the window can be seen below.

Similarly the anomaly data are stored in the database as .data and .meta files. Each satellite in the database has its own data file and the format is: time of the anomaly in ms (long), x- (double), y- (double), z-positions (double) in km GSM, local time sector in hours (double), anomaly type (int), and any further description (String). The anomaly metadata has the following fields: a short description of the anomaly data (String), the first observation (long), and the last observation (long).
As many of the future modules will use vector and matrix based operations a library supporting these operations has been developed.
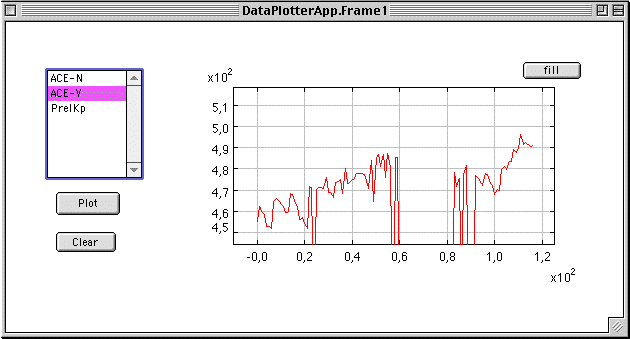
The data in the database can also be inspected using the data plotter. Future versions will also have the choice boxes so that the start and end dates can be selected.

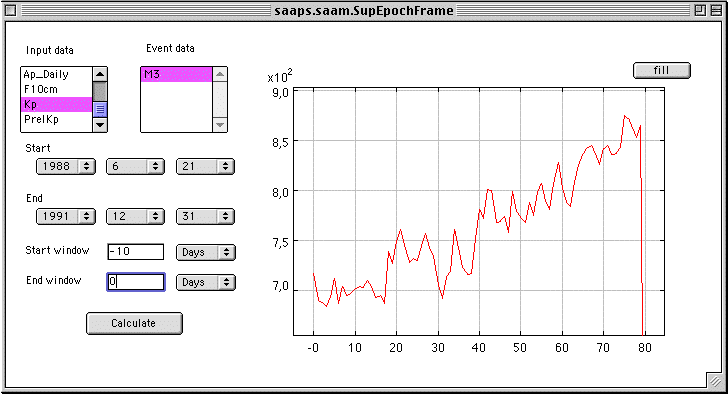
The superposed epoch analysis tool takes as input two data files: an input data file and an event data file. The input data could be e.g. the observed Kp values and the event file a satellite anomaly file. The user then selects the time period to study and the size of the superposed window (see figure below). Based on the times in the event data the input data is superposed for each event over the selected window size. The result is then displayed as a plot. The example below uses Meteosat-3 data for 1988 to 1991 to calculate the superposed Kp with a window from -10 days to day 0. At the moment the x-axis is just labelled with an index (8 values per day over 10 days) and the y-axis is the summed Kp. The trend of increasing Kp before an anomaly event (index=80) is clearly seen.

For these functions to be available in a web browser the user interfaces has to be rewritten as applets instead of applications. An interface also has to be determined so that the applet can access methods and data on the SAAPS server. There are two possible routes here: Java Servlets or Java Remote Method Invocation (RMI). Initial test with RMI seems promising.
The documentation of the SAAPS Java classes are available.
Last updated by Peter Wintoft, 1999-09-29.